Pandas is a Python Analysis package. In this case we use data from crime data per city. The data is [here][Pandas plotting]. It is based on crimes per 100,000 people:
Big Data Analysis with Pandas - Crime |
Outline
We can use Python Pandas to correlate crime factors. In this case we will use the US crime figures, for cities greater than 250,000 in population.
If we peek at the data set we can see that it contains the major cities of the US, and their crime figures (defined in crimes per 100,000 people):
Command used:  ver.head(3)
-------------------
        State         City  Population  Violent Crime  ...    Burglary  \
0  New Mexico  Albuquerque      558874            883  ...      1095.6
1  California      Anaheim      346956            317  ...       375.0
2      Alaska    Anchorage      301306            865  ...       456.3

   Larceny-Theft  Motor Vehicle Theft  Arson
0         3713.9                636.6   15.4
1         1619.8                367.5    6.6
2         3059.0                311.6   26.9

[3 rows x 13 columns]
We can use Pandas to view the columns that we have:
Command used:  ver.columns
-------------------
Index([u'State', u'City', u'Population', u'Violent Crime', u'Murder', u'Rape',
       u'Robbery', u'Aggravated Assault', u'Property Crime', u'Burglary',
       u'Larceny-Theft', u'Motor Vehicle Theft', u'Arson'],
      dtype='object')
and then take a quick look to see the cities, states and population:
Command used:  ver[['City','State','Population']]
-------------------
                     City                 State  Population
0             Albuquerque            New Mexico      558874
1                 Anaheim            California      346956
2               Anchorage                Alaska      301306
3               Arlington                 Texas      382976
4                 Atlanta               Georgia      454363
...
We can quickly analyse to see the top cities for violent crime:
Command used:  ver.sort(['Violent Crime'],ascending=False).head(3)
-------------------
         State     City  Population  Violent Crime  ...    Burglary  \
22    Michigan  Detroit      684694           1989  ...      1340.3
41   Tennessee  Memphis      654922           1741  ...      1748.5
51  California  Oakland      409994           1685  ...       977.1

    Larceny-Theft  Motor Vehicle Theft  Arson
22         2004.3               1472.6   71.6
41         3785.3                454.3   53.4
51         3376.1               1590.0   42.9

[3 rows x 13 columns]
where we can see that Detroit has the highest crime rate. For the lowest, we can just sort in the default way:
Command used:  ver.sort(['Violent Crime']).head(3)
-------------------
       State            City  Population  Violent Crime  ...    Burglary  \
77  Virginia  Virginia Beach      451102            146  ...       232.8
28    Nevada       Henderson      274121            165  ...       509.6
58     Texas           Plano      277822            165  ...       296.6

    Larceny-Theft  Motor Vehicle Theft  Arson
77         1861.2                 80.9   13.3
28         1288.1                180.6   10.6
58         1572.6                105.5    8.3

[3 rows x 13 columns]
and where we can see that Virginia Beach is the safest city for violent crime, with a difference of 146 against 1,989 (Detroit) per 100,000 of the population.
If we analyse for correlations we get:
Command used:  ver.corr()
-------------------
                     Population  Violent Crime    Murder      Rape    ...     \
Population             1.000000      -0.028001 -0.080121 -0.109170    ...
Violent Crime         -0.028001       1.000000  0.773356  0.462789    ...
Murder                -0.080121       0.773356  1.000000  0.225429    ...
Rape                  -0.109170       0.462789  0.225429  1.000000    ...
Robbery               -0.001758       0.868793  0.730574  0.290042    ...
Aggravated Assault    -0.029883       0.936628  0.680137  0.435095    ...
Property Crime        -0.225979       0.595086  0.409523  0.434580    ...
Burglary              -0.219976       0.664007  0.479502  0.469406    ...
Larceny-Theft         -0.205514       0.363479  0.195005  0.380208    ...
Motor Vehicle Theft   -0.101777       0.695585  0.574487  0.204724    ...
Arson                 -0.039368       0.413206  0.419322  0.206152    ...

                     Burglary  Larceny-Theft  Motor Vehicle Theft     Arson
Population          -0.219976      -0.205514            -0.101777 -0.039368
Violent Crime        0.664007       0.363479             0.695585  0.413206
Murder               0.479502       0.195005             0.574487  0.419322
Rape                 0.469406       0.380208             0.204724  0.206152
Robbery              0.569879       0.239852             0.705817  0.424400
Aggravated Assault   0.611032       0.376143             0.589304  0.334101
Property Crime       0.730903       0.921243             0.537994  0.352826
Burglary             1.000000       0.515304             0.484667  0.554869
Larceny-Theft        0.515304       1.000000             0.232070  0.161463
Motor Vehicle Theft  0.484667       0.232070             1.000000  0.355508
Arson                0.554869       0.161463             0.355508  1.000000

[11 rows x 11 columns]
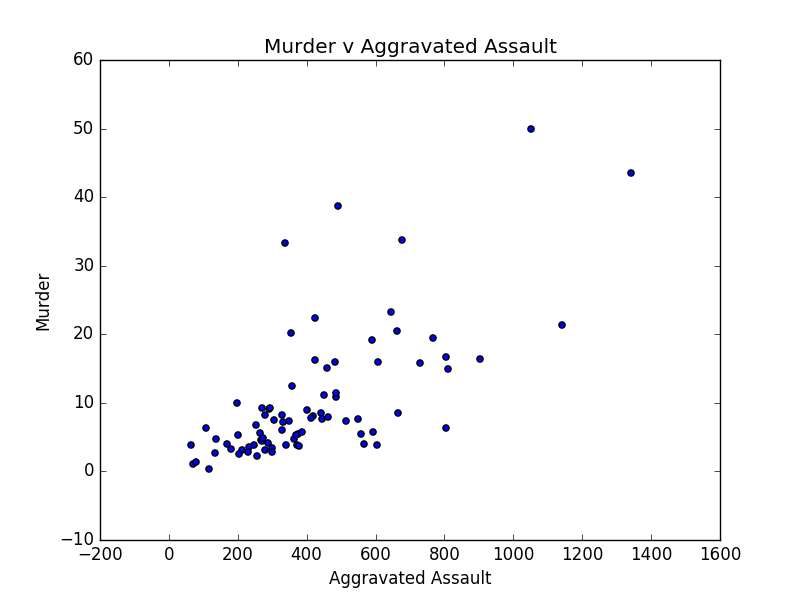
and can see there is a strong correlation between Aggravated Assault and Violent Crime (+0.94). If we now use Pandas to plot we get [Pandas plotting]:
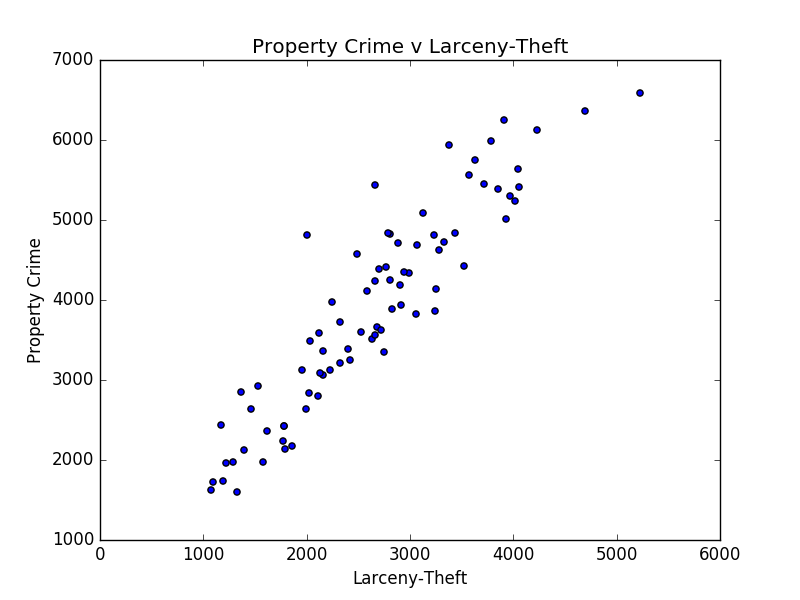
We can also see there if a strong link between Larceny-Theft and Property Crime (+0.92), and if we plot we get [Pandas plotting]:
For correlation a value of above 0.7 show a strong relationship:
- +/–1. A perfect uphill/downhill linear relationship.
- +/–0.70. A strong uphill/downhil linear relationship.
- +/–0.50. A moderate uphill/downhil relationship.
- +/–0.30. A weak uphill/downhil linear relationship.
- 0. No linear relationship.
We can now do some linear regression analysis (between Violent Crime and Burglary):
Command used:  sm.OLS(ver['Violent Crime'], ver['Burglary']).fit().summary()
-------------------
                            OLS Regression Results
==============================================================================
Dep. Variable:          Violent Crime   R-squared:                       0.870
Model:                            OLS   Adj. R-squared:                  0.869
Method:                 Least Squares   F-statistic:                     530.5
Date:                Thu, 07 Jul 2016   Prob (F-statistic):           8.51e-37
Time:                        13:05:14   Log-Likelihood:                -570.40
No. Observations:                  80   AIC:                             1143.
Df Residuals:                      79   BIC:                             1145.
Df Model:                           1
Covariance Type:            nonrobust
==============================================================================
                 coef    std err          t      P>|t|      [0.025      0.975]
------------------------------------------------------------------------------
Burglary       0.8776      0.038     23.033      0.000       0.802       0.953
==============================================================================
Omnibus:                        5.025   Durbin-Watson:                   1.825
Prob(Omnibus):                  0.081   Jarque-Bera (JB):                4.796
Skew:                           0.600   Prob(JB):                       0.0909
Kurtosis:                       2.975   Cond. No.                         1.00
==============================================================================
Data
The data used is [here]
City,State,Population,Violent Crime,Murder,Rape,Robbery,Aggravated Assault,Property Crime,Burglary,Larceny-Theft,Motor Vehicle Theft,Arson
New Mexico,Albuquerque,558874,883,5.4,71.9,247.1,558.4,5446.1,1095.6,3713.9,636.6,15.4
California,Anaheim,346956,317,4,22.8,120.5,170.1,2362.3,375.0,1619.8,367.5,6.6
Alaska,Anchorage,301306,865,4,130.1,164.6,565.9,3827.0,456.3,3059.0,311.6,26.9
Texas,Arlington,382976,484,3.4,53.8,128.7,298.2,3515.1,644.9,2633.6,236.6,6.8
Georgia,Atlanta,454363,1227,20.5,33.2,512.6,661.1,5747.4,1203.9,3631.0,912.5,16.5
Colorado,Aurora,350948,413,3.1,78.1,118.8,212.6,2838.6,517.5,2018.0,303.2,21.7
Texas,Austin,903924,396,3.5,63.2,96.6,232.9,4142.4,634.2,3255.0,253.1,10.5
California,Bakersfield,367406,457,4.6,5.7,179.6,266.7,3972.4,1106.4,2244.7,621.4,101.3
Maryland,Baltimore,623513,1339,33.8,39.3,589.7,675.7,4718.4,1110.8,2888.2,719.5,34.2
Massachusetts,Boston,654413,726,8.1,42.8,256.7,418.1,2638.9,409.5,1998.3,231.0,30.0
New York,Buffalo,258419,1228,23.2,67.3,494.2,643.5,4817.4,1207.0,3235.8,374.6,30.0
Arizona,Chandler,252369,185,0.4,23.8,44,116.5,2236.0,378.0,1767.6,90.3,38.4
North Carolina,Charlotte-Mecklenburg,856916,590,5.5,24.5,185.1,374.7,3566.9,703.8,2663.9,199.2,19.3
California,Chula Vista,259894,236,2.7,15.4,82.3,135.1,1740.7,235.9,1189.3,315.5,13.5
Illinois,Chicago,2724121,884,15.1,49.3,359.9,460.0,3126.2,533.6,2224.6,367.9,16.9
Ohio,Cincinnati,297671,905,20.2,76.6,455.5,353.1,5562.2,1619.2,3574.1,368.9,118.6
Ohio,Cleveland,388655,1334,16.2,124,769.3,424.8,5434.4,1787.7,2659.2,987.5,78.2
Colorado,Colorado Springs,444949,458,4.5,92.6,90.8,270.4,3667.6,620.1,2677.6,369.9,21.1
Ohio,Columbus,830811,549,10,88.8,252.5,197.9,4253.0,1091.2,2807.9,353.9,30.0
Texas,Corpus Christi,319211,656,8.5,87.7,118.1,441.7,4420.3,725.5,3519.0,175.7,15.7
Texas,Dallas,1272396,665,9.1,61.4,303.1,291.1,3589.2,918.3,2117.2,553.7,30.3
Colorado,Denver,665353,599,4.7,67.3,164,362.7,3359.4,684.6,2158.7,516.1,20.7
Michigan,Detroit,684694,1989,43.5,81.4,521.4,1342.4,4817.2,1340.3,2004.3,1472.6,71.6
Texas,El Paso,680273,393,3.1,49.2,61,279.3,2141.8,232.1,1789.0,120.7,7.1
Indiana,Fort Wayne,257172,317,4.7,40.4,134.9,137.3,3247.6,686.3,2419.8,141.5,17.5
Texas,Fort Worth*,789035,560,6.1,66.3,159.2,328.6,4343.5,1053.9,2985.5,304.0,19.6
California,Fresno,513187,464,9.2,10.3,152.2,292.5,4111.8,919.9,2587.2,604.7,50.5
North Carolina,Greensboro,282203,477,8.2,18.4,172.6,277.8,3600.2,888.7,2522.7,188.9,40.4
Nevada,Henderson,274121,165,1.1,32.5,60.2,71.1,1978.3,509.6,1288.1,180.6,10.6
Texas,Houston,2219933,991,10.9,36.6,458.8,485.1,4693.7,974.3,3068.8,650.6,32.3
Indiana,Indianapolis,858238,1255,15.8,66.8,443.7,728.4,4823.1,1412.8,2806.9,603.4,31.6
Florida,Jacksonville,856021,684,11.2,56,165.8,450.8,3940.6,795.1,2914.1,231.4,10.7
New Jersey,Jersey City,260005,531,9.2,13.5,238.5,270.0,1630.7,341.1,1078.4,211.1,14.2
Missouri,Kansas City,468417,1251,16.7,83.3,346.9,804.6,4835.0,1208.1,2783.2,843.7,46.3
Texas,Laredo,250994,389,5.6,39.4,78.1,265.7,3859.5,504.8,3244.7,110.0,29.9
Nevada,Las Vegas,1530899,841,8,51,319.1,463.1,2923.4,924.3,1530.6,468.5,9.2
Kentucky,Lexington,311848,334,6.4,43,177.7,106.8,3891.0,767.4,2827.0,296.6,13.8
Nebraska,Lincoln,271208,339,2.6,56,75.6,204.3,3348.7,481.2,2747.7,119.8,24.0
California,Long Beach,471123,489,4.9,23.3,188.7,272.1,2640.1,739.1,1459.3,441.7,16.6
California,Los Angeles,3906772,491,6.7,28.8,203.5,251.8,2128.1,385.7,1389.4,352.9,29.1
Kentucky,Louisville Metro,677710,591,8.3,27.2,225.9,329.6,4185.3,946.9,2902.3,336.1,30.0
Tennessee,Memphis,654922,1741,21.4,76.5,501.6,1141.1,5988.0,1748.5,3785.3,454.3,53.4
Arizona,Mesa,462092,459,2.8,54.5,101.5,299.7,2800.3,510.3,2108.7,181.3,18.4
Florida,Miami,421996,1060,19.2,26.1,424.2,590.5,4832.7,867.1,3439.4,526.3,15.6
Wisconsin,Milwaukee,600374,1476,15,65.8,586.3,809.3,4580.3,987.6,2484.6,1108.1,46.0
Minnesota,Minneapolis,404461,1012,7.7,96.2,462.6,445.5,4728.0,1016.7,3332.8,378.5,28.9
Alabama,Mobile,250655,594,12.4,54.3,170.8,356.3,4629.1,1135.8,3281.4,211.8,30.0
Tennessee,Nashville,647689,1123,6.3,75.2,235.1,805.8,3630.6,734.3,2720.8,175.5,15.0
Louisiana,New Orleans,387113,974,38.7,63,379.7,492.4,4231.8,893.3,2663.0,675.5,30.0
New York,New York,8473938,597,3.9,25.8,195.7,371.3,1601.9,187.8,1323.0,91.2,30.0
New Jersey,Newark,279110,1078,33.3,17.6,688.6,338.2,2851.2,622.0,1365.1,864.2,14.0
California,Oakland,409994,1685,19.5,51,849,765.9,5943.3,977.1,3376.1,1590.0,42.9
Oklahoma,Oklahoma City,617975,774,7.3,70.2,182.2,514.1,4410.9,1074.2,2768.9,567.8,15.5
Nebraska,Omaha,438465,561,7.3,41.1,164.9,347.3,4345.4,683.5,2944.4,717.5,8.4
Florida,Orlando,259675,901,5.8,64.3,238.8,592.3,6359.9,1287.0,4691.2,381.6,21.2
Pennsylvania,Philadelphia,1559062,1021,15.9,77.4,447.1,481.1,3387.7,621.8,2398.5,367.4,25.6
Arizona,Phoenix,1529852,572,7.5,65.8,193,305.7,3724.3,935.8,2317.9,470.6,20.5
Pennsylvania,Pittsburgh,307613,798,22.4,29.6,320.5,425.5,3212.8,692.1,2326.6,194.1,62.4
Texas,Plano,277822,165,1.4,28.8,56.2,78.8,1974.6,296.6,1572.6,105.5,8.3
Oregon,Portland,615672,473,4.2,42.6,137.6,288.5,5234.8,673.4,4013.0,548.3,27.0
North Carolina,Raleigh,428993,392,2.8,18.4,141,230.1,3063.0,735.9,2162.7,164.3,12.6
California,Riverside,319453,433,3.8,44.8,138,246.7,3087.8,479.3,2126.8,481.8,27.5
California,Sacramento,482767,615,5.8,16.2,207.1,385.7,3123.2,670.7,1956.0,496.5,35.0
Texas,San Antonio,1428465,539,7.2,75.4,124.4,332.3,5417.8,864.1,4053.9,499.8,20.9
California,San Diego,1368690,381,2.3,27.1,96.3,255.2,1959.0,373.7,1219.5,365.8,15.3
California,San Francisco,850294,795,5.3,41.8,379.2,368.9,5303.2,615.9,3966.9,720.5,28.3
California,San Jose,1009679,321,3.2,30.3,106.2,181.4,2434.1,511.7,1173.6,748.8,12.2
California,Santa Ana,336462,375,5.3,34.2,134.3,200.6,1719.1,235.7,1095.2,388.2,6.2
Washington,Seattle,663410,603,3.9,23.2,236.2,339.8,6127.3,1070.1,4226.0,831.2,11.9
Missouri,St. Louis,318574,1679,49.9,87.6,490.3,1050.9,6252.6,1321.2,3912.1,1019.2,59.6
Minnesota,St. Paul,297984,663,3.7,60.7,219.5,378.5,3484.4,781.9,2028.6,673.9,39.9
Florida,St. Petersburg,250772,865,7.6,61.4,246.8,549.1,5642.6,1041.6,4043.1,557.9,17.5
California,Stockton,299519,1332,16.4,44.7,366.6,903.8,4389.7,1043.0,2698.3,648.4,25.4
Florida,Tampa,357124,582,7.8,17.4,143.9,413.3,2427.7,509.6,1779.5,138.6,12.0
Ohio,Toledo,281150,1091,8.5,82.2,335.8,664.8,2427.7,1668.5,1779.5,337.5,30.0
Arizona,Tucson,525486,641,8.9,41.1,190.7,400.2,6581.9,943.3,5221.8,416.8,28.7
Oklahoma,Tulsa,399556,805,11.5,78.3,230.3,485.0,5081.6,1376.5,3127.0,578.1,34.5
Virginia,Virginia Beach,451102,146,3.8,23.7,55.9,63.0,2174.9,232.8,1861.2,80.9,13.3
District of Columbia,Washington,658893,1185,15.9,71.3,490.4,607.7,5012.5,525.6,3928.0,559.0,13.3
Kansas,Wichita,386486,793,3.9,63.1,121.1,604.9,5382.3,1017.6,3851.4,513.3,29.2