When A Cybersecurity Package and Big Data Save Lives …

When A Cybersecurity Package and Big Data Save Lives …
And so Splunk has shown the world how to should use Big Data within cyber security. But the potential of Splunk is so much great than using it for Cybersecurity, and will keep your marketing department happy that they know the number of people who use iPhones that access their site, and keep IT Support happy logging the down time on the network. In fact, Splunk is one of the easiest sells to an executive team, and provides a way for companies to merge their data into a single data infrastructure. If you add Hadoop into the equation, then you are becoming a company which takes data seriously.
While Splunk has been a massive success within cybersecurity and in business analytics, it is now moving into other areas [here]:

We can thus imagine a future where Splunk could be used by health care systems, and where we could apply machine learning into diagnosing on onset of illnesses. Many privacy concerns would have to be addressed, of course, including in the anonymisation of the data gathered, and in citizen ownership of the data. Our health care systems could thus move from fixing illnesses, to predicting the onset of illnesses. In this way we can perhaps interveen in care and prevent the further onset of an illness, or better care for our citizens as they near the end of their life.
When you think about it, the jump from monitoring the security alerts within a company to monitoring the human body and its surroundings, is not a major one. With this we just define our signatures … a heart rate jump, or temperature increase … and our anomolies … the lack of a heart beat or no breathing, and then we just alert. These alerts can then go into an alert log, and be kept for analysis by a clinical, or could be sent through as an emergency clinical alert. Thing about this as a ransomware attack on a company, and where the company must act quickly.
In this was Bob the Clinician can look after Alice the Citizen, and have rights to her alerts. On reviewing her health, he can look back at clincial alerts, and use the power of Splunk to find significant events and timeline them. Our GPs could soon become Data Scientists, too. But when a serious clinical event happens, Bob can be alerted through the alerting mechanisms that he has approved with Alice:
The alerts too could be sent to Alice’s family, and they can help respond to Alice’s need for support. Looking for clinical issues can thus be seen as a similar thing to threat hunting in cybersecurity, and where a clinician finds a standard pattern for a diagnosis or an anomaly, and then traces it. These signature patterns that identify the onset of illness could easily be identified, but the power of Splunk is that the searching and analysis is in the hands of the professional.
If you are interested in the potential of Splunk, here is a quick overview …
The Era of Big Data … and Splunk is King
It looks like we are heading into an era where data is King, and where organisations build their strategies on real-life data. A key part of this is to move away from structured data, stored within relational databases, towards unstructured data, and which can be mined for its structure in whatever way the user wants.
With relational databases we automatically structure the data whenever we put it into tables, and where it is difficult to create the hierarchy that we want, as we are already defining the linkages within the data. In many cases, though, a trail of activity can be traced across many of these table, and the linkages are difficult to define for every single situation. For example, if I log into a system, we will see my IP address in a data packet, then we see my IP address logged on the connection to the system, and then you will see activity in the programs that I ran and the data I access. In a relational database, all the different types of activities would store information about the session, such as in a network packet log, a server login log, and an activity log.
There are many ways which we can link these tables together, but in relationship databases we typically have to define all the ways that these can be linked. Also the process of converting from the log to the database, also typically loses data along the way.
Log All … Forgot Nothing … Never Aggregate
With unstructured data, we just dump all our data, in its original format, and then hope that we can structure it within the context of a search. This leads to a “log all, forget nothing, never aggregate” approach, where we dump everything into massive datastores, and the process when we require information. The four uses we can have are:
- Archived. This provides access to previously stored information, in order to provide information related to network or a business requirement. With unstructured we never aggregate, so we can re-compute based on any timeline that we want.
- Forensics. This provides us with information that might relate to a criminal event, where data can be traced back in any possible. If we log with the original form, and do not aggregate, the original sources of the data can be used for the evidence.
- Audit. Many organisations require to prove that they implement certain procedures, both from an internal and an external way. With auditing, we can provide information on all the information that was gathered, and how it was used within the organisaiton.
- Real-time analytics. With this, we can use our logs to provide near real time information on business analytics, where we can ask any question at any time. How many people are working from home today? How many users have logged into our Web site in the past day? Which day and time is the most popular on our Web site?
Within a few years we can see that a whole lots of data will be gathered within organisations, and possibly shared with other trusted partners. This obviously opens up many issues related to privacy, but this is likely to be overcome by the benefits of using it. A key focus for the collection of this data in organisations is likely to focus on logs which not only can be used for security events, but also for business and marketing purposes. Thus a Web server log can be used by many users in an organisation:
- System Administrator: Which page not founds are appearing on the Web server?
- Security Manager: Which IP address is creating a DoS on the server?
- Sales Manager: How many successful sales have their been this month?
- Marketing Manager: What is the success rate of this page for follow-through sales?
- Web Manager: Which pages have the longest dwell time?
Don’t lose that data sample…
The non-aggregation of data, typically means that we have to re-compile the data for each search. This can be overcome, though, using standard reports, and uses these as an output to the system. In this way we can create audit points, with an export. If we do aggregate, and lose the original data. For example a researcher might take ten readings, and make an average of them. The first readings are 0, 5, 0, 5, 0, and 5, and the next readings are 2.5, 2,5, 2.5, 2.5. 2.5, and then reports on the averages and the standard deviations. But the problem we see hear, is that the trends of the data has been lost, along with the problem of them both having the same average, and, most significantly, the usage of a standard deviation is completely wrong, as the distribution of the samples has no relationships to a normal distribution. A while back we proposed this model for clinical data, with the concept of a data bucket for each clinical parameter, and where data related to that parameter was just dumped into the data bucket, and where the encryption key was owned by the patient. If you are interested, the paper is here:
DACAR Platform for eHealth Services Cloud. IEEE 4th International Conference on Cloud Computing, 219–226.
Cloud storage of unstructured data
We can thus see that the logs from the site can thus be used by many stakeholders, and be used for analytics. In this era we will typically not structure our data into fields, or even process it. This is because data storage is becoming inexpensive, where a 1TB disk can cost as little as $50, and which could store over 20 billion log messages from a Web server. With the Amazon S3 storage cloud, it costs just 3 cents for 1 GB of data per month. So we can now capture and archive a massive amount of logs, and then use clustered systems to process and tag these. Many organisations are now investing in cluster systems, such as with Hadoop, in order to process these logs, in order to produce useful analytics on their operations. As the time required to react to security alerts reduces, there is thus a need to quickly spot trends.
One major problem with datastores using relational database in the past has been that relationships can be easily structured within the fields defined in each of the tables, but this fixes the mining of the data. In many new applications, there is no fixing of the data into table, and the logs are kept unstructured. This allows for the data in each log to be mined for the requirements. In this way many different logs can be brought together using different bindings.
The Big Stick or the Big Data?
In the past system logs have typically been gathered for auditing and compliance reasons, where firewall and Intrusion Detection System (IDS), and server logs were gathered to assure that the systems were monitored. One of the main ones is PCI-DSS, which is used when organisations undertake some e-Commerce functions. It can be seen from Figure 1 that PCI-DSS compliance involves the monitoring and testing of networks, and also requires to monitor accesses to the network. Thus the big stick for logging information in this case is PCI-DSS. So if an organisation needs to log security and network information, and this is accepted from a user point of view, we have a rich seam of information that we can use to provide business analytics.
The user, in this case, mostly doesn’t actually know that their information is being used, but, mostly, they will be okay about it, as it is being used to stop fraud, and is only gathering network and Web information, and not necessarily information about them. For example, if a user is purchasing something from home, they are likely to be using NAT, which hides their tracks, by only providing a single IP address from the pool of IP addresses from the ISP. So with less expensive computing and storage power available, we can now harness these logs to actually drive the business analytics of the organisation, and provide real-time analytics. The days of waiting around for the quarterly reports on usage statistics are gone, and companies now need real-time information to assess their opportunities and threats.

Figure 1: PCI-DSS
Web Server Logs
Web server logs can provide a whole lots of security information, along with business information. If we look at a standard Apache Web log we can see the information that we can mine from the log (access.log):
209.160.24.63 - - [11/Mar/2014:18:22:16] "GET /product.screen?productId=WC-SH-A02&JSESSIONID=
SD0SL6FF7ADFF4953 HTTP 1.1" 200 3878 "http://www.google.com" "Mozilla/5.0 (Windows NT 6.1; WOW64)
AppleWebKit/536.5 (KHTML, like Gecko) Chrome/19.0.1084.46 Safari/536.5" 349
209.160.24.63 - - [11/Mar/2014:18:22:16] "GET /oldlink?itemId=EST-6&JSESSIONID=
SD0SL6FF7ADFF4953 HTTP 1.1" 200 1748 "http://www.buttercupgames.com/oldlink?itemId=EST-6"
"Mozilla/5.0 (Windows NT 6.1; WOW64) AppleWebKit/536.5 (KHTML, like Gecko) Chrome/19.0.1084.46
Safari/536.5" 731
209.160.24.63 - - [11/Mar/2014:18:22:17] "GET /product.screen?productId=BS-AG-G09&JSESSIONID=
SD0SL6FF7ADFF4953 HTTP 1.1" 200 2550 "http://www.buttercupgames.com/product.screen?productId=BS-AG-G09"
"Mozilla/5.0 (Windows NT 6.1; WOW64) AppleWebKit/536.5 (KHTML, like Gecko)
Chrome/19.0.1084.46 Safari/536.5" 422
We can see that we can now timeline the transactions on a site and the links accessed. Also we have the information the HTTP response code, where at 200 defines that the HTTP request was successful, and a 404 means that the page was not found. Let’s now search for the GET HTTP request and view the number of transactions. Figure 2 shows the result, where for this example, we get 26,866 results.

Figure 2: GET transactions
If we use a smart mode, as shown in Figure 1, with Splunk, we can automatically parse the log in order to mine the information in the fields from the GET request (Figure 3).

Figure 3: Parsing the log entry
This view now allows us to mine the data associated with each of the fields. For example we can mine for the Client IP address to see the highest number of accesses:
Top 10 Values     Count     %
87.194.216.51     651     2.618%
211.166.11.101    473     1.902%
128.241.220.82    364     1.464%
194.215.205.19    316     1.271%
188.138.40.166    276     1.11%
109.169.32.135    257     1.034%
107.3.146.207     215     0.865%
216.221.226.11    195     0.784%
74.208.173.14     190     0.764%
74.53.23.135      189     0.76%
So straight-away we can find out the main IP addresses who have been accessing our sites. Next we can have a look at all the HTTP response codes so see how our site is performing:
Values     Count     %
200  20,890     84.01%
408     591     2.377%
500     588     2.365%
400     573     2.304%
406     565     2.272%
404     553     2.224%
503     527     2.119%
505     391     1.572%
403     188     0.756%
So we can see that most of the responses give us a 200 (OK) response, but there are other codes which could identify either a problem with the Web site, or security events. A 408, for example, is a request timeout error, which perhaps shows a problem on the Web site for some transactions. Also a 404 error is a file not found response, which either means that there’s a missing file on the site, or someone could be fishing for files. Our search can now become (Figure 4):
get status=404

Figure 4: GET 404
So again we can mine for the Client IP address to see the hosts that are generating most of the requests for files not found:
Top 10 Values     Count     %
87.194.216.51     18     3.255%
211.166.11.101    12     2.17%
88.12.32.208       9     1.627%
124.160.192.241    8     1.447%
128.241.220.82     8     1.447%
91.205.189.15      8     1.447%
109.169.32.135     7     1.266%
117.21.246.164     7     1.266%
148.107.2.20       7     1.266%
175.44.1.122       7     1.266%
So there was thus 18 requests from 87.194.216.51 for file not found. So we can then search for:
get status=404 clientip="87.194.216.51"
This gives us 18 events of:
87.194.216.51 - - [17/Mar/2014:18:21:45] "GET /search.do?items=2112&JSESSIONID=
SD2SL1FF10ADFF46115 HTTP 1.1" 404 1585 "http://www.buttercupgames.com/cart.do?action=
view&itemId=EST-16" "Mozilla/5.0 (Windows; U; Windows NT 5.1; en-US; rv:1.9.2.28)
Gecko/20120306 YFF3 Firefox/3.6.28 ( .NET CLR 3.5.30729; .NET4.0C)" 920
87.194.216.51 - - [17/Mar/2014:17:52:09] "GET /productscreen.html?t=ou812&JSESSIONID=
SD2SL3FF1ADFF46010 HTTP 1.1" 404 2391 "http://www.buttercupgames.com/product.screen?productId=
SF-BVS-G01" "Opera/9.20 (Windows NT 6.0; U; en)" 575

87.194.216.51 - - [17/Mar/2014:10:30:39] "GET show.do?productId=SF-BVS-01&JSESSIONID=
SD2SL7FF10ADFF43983 HTTP 1.1" 404 1870 "http://www.buttercupgames.com/cart.do?action=
view&itemId=EST-12" "Mozilla/5.0 (compatible; MSIE 9.0; Windows NT 6.1; WOW64; Trident/5.0;
BOIE9;ENUS)" 908
87.194.216.51 - - [17/Mar/2014:00:11:08] "GET /hidden/anna_nicole.html?JSESSIONID=
SD4SL6FF7ADFF40941 HTTP 1.1" 404 2262 "http://www.buttercupgames.com/oldlink?itemId=EST-19"
"Mozilla/4.0 (compatible; MSIE 7.0; Windows NT 5.1; .NET CLR 2.0.50727; .NET CLR 3.0.4506.2152;
.NET CLR 3.5.30729; InfoPath.1; .NET4.0C; .NET4.0E; MS-RTC LM 8)" 612

87.194.216.51 - - [16/Mar/2014:11:10:31] "GET /stuff/logo.ico?JSESSIONID=SD10SL4FF8ADFF37373
HTTP 1.1" 404 3166 "http://www.buttercupgames.com/oldlink?itemId=EST-6" "Googlebot/2.1
(http://www.googlebot.com/bot.html)" 932
87.194.216.51 - - [16/Mar/2014:05:41:17] "GET /stuff/logo.ico?JSESSIONID=SD6SL4FF7ADFF36073
HTTP 1.1" 404 310 "http://www.buttercupgames.com/product.screen?productId=SF-BVS-G01"
"Mozilla/5.0 (Windows NT 6.1; WOW64) AppleWebKit/536.5 (KHTML, like Gecko) Chrome/19.0.1084.46
Safari/536.5" 778
87.194.216.51 - - [16/Mar/2014:04:33:26] "GET /passwords.pdf?JSESSIONID=SD6SL2FF1ADFF35804
HTTP 1.1" 404 1001 "http://www.buttercupgames.com/category.screen?categoryId=NULL"
"Mozilla/5.0 (Windows NT 5.1) AppleWebKit/536.5 (KHTML, like Gecko) Chrome/19.0.1084.52
Safari/536.5" 497
One thing we can notice is that there is an access to passwords.pdf, which looks suspicious, so let’s mine for that:
passwords.pdf
This can then be used to determine the range of IP addresses that searched for this file, and gives:
178.162.239.192    3     4.412%
87.194.216.51      3     4.412%
110.159.208.78     2     2.941%
118.142.68.222     2     2.941%
128.241.220.82     2     2.941%
198.35.1.10        2     2.941%
210.76.124.106     2     2.941%
211.166.11.101     2     2.941%
221.204.246.72     2     2.941%
69.72.161.186      2     2.941%
Business analytics
The great thing about log analysis is that we can also use the same logs for security to analyse business activity. The first thing can be observed is that the action used to purchase goods on the Web site is “purchase”, so let’s search for purchased items:
sourcetype=access_* status=200 action=purchase | top categoryId
This then gives us a table of the succesful purchases (which are uses that return a 200 code):
categoryId     count  percent
STRATEGY      806     30.495649
ARCADE        493     18.653046
TEE           367     13.885736
ACCESSORIES   348     13.166856
SIMULATION    246     9.307605
SHOOTER       245     9.269769
SPORTS        138     5.221339
Next we can find the number of unsuccessful purchases with:
sourcetype=access_* status!=200 action=purchase | top categoryId
to give:
categoryId   count     percent
STRATEGY     79     23.442136
NULL         71     21.068249
ARCADE       44     13.056380
ACCESSORIES  39     11.572700
TEE          37     10.979228
SHOOTER      30     8.902077
SIMULATION   27     8.011869
SPORTS       10     2.967359
and even visualise the sales with (Figure 5):
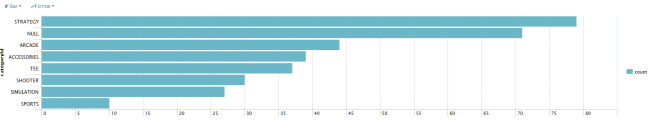
Figure 5: Games sales from Web log
Now our marketing department want to know which is the most popular Web browser, so we can use a search of:
get| top limit=20 useragent
and to give:
get| top limit=20 useragent
- Mozilla/5.0 (Windows; U; Windows NT 5.1; en-US; rv:1.9.2.28) Gecko/20120306 YFF3 Firefox/3.6.28 ( .NET CLR 3.5.30729; .NET4.0C) 5282 21.241856%
- Mozilla/5.0 (Windows NT 6.1; WOW64) AppleWebKit/536.5 (KHTML, like Gecko) Chrome/19.0.1084.46 Safari/536.5 2383 9.583367
- Mozilla/4.0 (compatible; MSIE 7.0; Windows NT 5.2; .NET CLR 1.1.4322; InfoPath.1; MS-RTC LM 8) 2130 8.565913
- Mozilla/5.0 (Macintosh; Intel Mac OS X 10_7_4) AppleWebKit/536.5 (KHTML, like Gecko) Chrome/19.0.1084.46 Safari/536.5 2021 8.127564
- Mozilla/4.0 (compatible; MSIE 7.0; Windows NT 5.1; Trident/4.0; .NET CLR 2.0.50727; MS-RTC LM 8; InfoPath.2) 1898 7.632912
- Mozilla/5.0 (compatible; MSIE 9.0; Windows NT 6.1; WOW64; Trident/5.0; BOIE9;ENUS) 1770 7.118153
- Mozilla/5.0 (Macintosh; Intel Mac OS X 10_6_8) AppleWebKit/534.55.3 (KHTML, like Gecko) Version/5.1.5 Safari/534.55.3 1121 4.508164
- Mozilla/5.0 (iPad; U; CPU OS 4_3_5 like Mac OS X; en-us) AppleWebKit/533.17.9 (KHTML, like Gecko) Version/5.0.2 Mobile/8L1 Safari/6533.18.5 1064 4.278935
- Mozilla/5.0 (iPad; CPU OS 5_1_1 like Mac OS X) AppleWebKit/534.46 (KHTML, like Gecko) Version/5.1 Mobile/9B206 Safari/7534.48.3 1000 4.021556
- Mozilla/5.0 (Windows NT 6.1; WOW64) AppleWebKit/536.5 (KHTML, like Gecko) Chrome/19.0.1084.52 Safari/536.5 992 3.989383
- Opera/9.01 (Windows NT 5.1; U; en) 430 1.729269
We can then see from this that Firefox running on Windows is our most popular browser, followed by Chrome running on Mac OS (AppheWebkit) and then Microsoft Internet Explorer Version 7. This type of information is obviously important for the design of a site, as it focuses the development on the browsers that will typically be used to access the site. Then, if we classify for Safair, Chrome and Mozilla we can chart with:
sourcetype=access_* | chart  count(eval(searchmatch("Safari")))  AS Safari,
count(eval(searchmatch("Chrome")))  AS Chrome, count(eval(searchmatch("Mozilla"))) AS Mozilla
by host
and then we can chart types with:

Figure 6: Browser analysis
Selecting the right parameters for a call
When we view a URI, we see is that the parameters used, and which can be mined:
182.236.164.11 — — [18/Mar/2014:18:20:54] “POST /cart.do?action=purchase&itemId=EST-6&JSESSIONID=SD6SL8FF10ADFF53101 HTTP 1.1″ 200 1803 “http://www.buttercupgames.com/cart.do?action=addtocart&itemId=EST-6&categoryId=ARCADE&productId=MB-AG-G07” “Mozilla/5.0 (Macintosh; Intel Mac OS X 10_7_4) AppleWebKit/536.5 (KHTML, like Gecko) Chrome/19.0.1084.46 Safari/536.5” 524
182.236.164.11 — — [18/Mar/2014:18:20:53] “POST /cart.do?action=addtocart&itemId=EST-6&productId=MB-AG-G07&JSESSIONID=SD6SL8FF10ADFF53101 HTTP 1.1″ 200 533 “http://www.buttercupgames.com/product.screen?productId=MB-AG-G07” “Mozilla/5.0 (Macintosh; Intel Mac OS X 10_7_4) AppleWebKit/536.5 (KHTML, like Gecko) Chrome/19.0.1084.46 Safari/536.5” 470
For example we have action, productID and itemID as parameters which are set, and passed back to the server. Thus we can mine these for the action undertaken, and the products. So we can search now for ProductIDs with:
post action=purchase action=purchase productid
To give:
productId     count     percent
WC-SH-G04     275     9.404925
SC-MG-G10     273     9.336525
DB-SG-G01     266     9.097127
MB-AG-T01     231     7.900137
DC-SG-G02     226     7.729138
MB-AG-G07     223     7.626539
FS-SG-G03     221     7.558140
WC-SH-A02     205     7.010944
WC-SH-A01     182     6.224350
WC-SH-T02     173     5.916553
PZ-SG-G05     172     5.882353
FI-AG-G08     163     5.574555
BS-AG-G09     151     5.164159
CU-PG-G06     148     5.061560
SF-BVS-G01     15     0.51
Conclusions
And so Splunk has grown-up, and could now be used in health care, and where it might be able to predict the early signs of an illness, and alert clinicians. While there would be many issues around data privacy to be sorted-out, it should be possible to design systems which cared for people and understood the risks they face.
And for us, we are start a new research project with Data Labs (Scotland), and which focuses on Splunk, machine learning and insider threat detection. We hope to apply key methods around anonymisation, and data ownership, to create new models of alert and learning. Along with this we have PhD work looking to use machine learning on encrypted data, within our Blockpass ID Lab.
Watch this space for more information.