My Top 5 Tips For New Cybersecurity Graduates, Splunk and COVID-19

My Top 5 Tips For New Cybersecurity Graduates, Splunk and COVID-19
If you are into Cybersecurity, get into Splunk or Elastic, and the world of data analysis will be at your fingertips. So my Top 5 tips for any new graduate in Cybersecurity — in fact any computer science graduate —is:
- Learn cryptography. Honestly, it’s building a new world, and is fixing the Internet. You should especially focus on public key encryption, as it will be the foundation of our future. But, don’t surface learn … and, if you have time, have a look at Hyperledger — it truly is the architecture to build future systems.
- Learn Python. Do you need me to say it again — learn Python! I will say it one more time, just in case you missed it — LEARN PYTHON! There’s no much need to right extensive code anymore, but Python drives data analysis and processing. And, while you are at it .. go setup your GitHub, and use it to sync your docs, code, and everything else you might need.
- Learn network protocols. Get into how network protocols work, and try and understand who data goes from one application to another, and all the data that goes along with it.
- Get into Splunk or Elastic. Honestly, it’s the future! Dump Excel and Word, and go use a tool which can properly analyse data and present information. Data will increasingly drive cybersecurity, so the jobs of the future will be those who can code a bit, and can analyse and present. You will get promoted on the beautiful charts you can produce to your executive team. Remember, it’s not about driving the package, it is about your ability to make sense of disperate data sets and their linkages.
- Get into machine learning. You can’t avoid the power of the machine for too long. While humans are great at abstraction, computers have the ability to try out many more models that we could even think off.
And don’t just surface learn, get in, and know these things with great depth.
COVID-19 and Splunk
Over the past few weeks I’ve been analysing SIR (susceptible (S) infected (I); recover (R)) models for COVID-19:
Unfortunately, in the UK, the SIR model is difficult to predict, as the country doesn’t report on those that are recovered:

The prediction model doesn’t then work as it is biased toward the death rate:

Fortunately most other countries report the recovery data and it is thus possible to predict an infection model:

Along with this I’ve been analysing the COVID-19 data with Splunk, and it provides virtually every sort of analysis you would ever want to do on the pandemic data. As it’s Splunk, it’s all about Python, and underneath you just run reveal.py, and it downloads all the required data from the Johns Hopkins University’s CSSE group GitHub:

The App tools, we require are Canary (a visualisation front-end) SideView ( ) which provides user interaction tools) and the Covid19 data dashboard:

The dataset takes all of the data gathered, but then defaults to a visualisation of 15 countries/regions of the world. It also provides daily prediction data on each country:

And so one of the great things about Splunk is its usage of dashboards, and in the COVID-19 App, we see the high-level presentation of the key data:

But then a click on one of the graphs, and we’re into a deeper analysis:

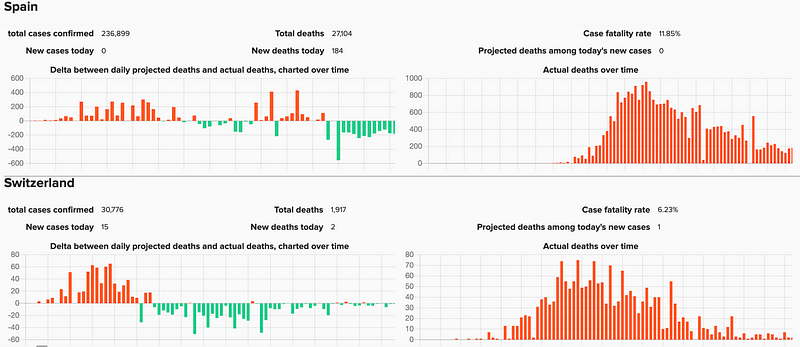
But then the power of Splunk comes in when we ask it to forecast. In this case we forecast the number of fatalities for Spain and Switzerland, and where the graph on the left hand side shows the forcast (orange shows more than estimate, and the green bar shows less than estimate):
It can be seen below that the UK has a strange glitch on 29 April 2020, and where they reported an accumulation of other related fatalities on the single day:

This spike related to the UK reporting previous fatalities in care homes:

What is obvious here is that countries need to understand the data that needs to be gathered, and try and get accurate figures each day. For the UK, it should have been understood early on that data from deaths in the home and in care homes would be important to understand the spread of the virus.
Another good feature of the Splunk analysis, is the deep down analysis of each area with a US state. In this case we see Alabama broken down, and where health professionals can understand the spread of COVID-19 down to a macro level:

And so, go do Python … go do some data analysis, and make up your own mind on things.
If you want to get into machine learning and Splunk, we are running a course here:
Eventbrite - The Cyber Academy presents Cyber & Data: Cybersecurity and Machine Learning using Splunk - Wednesday, 1…www.eventbrite.co.uk
And this is just part of a whole new MOOC on Cyber&Data … supported by the wonderful The Data Lab … so watch this space.