Using Splunk to Predict Health Care

Using Splunk to Predict Health Care
Splunk is seen as a great tool for cybersecurity, but it does a whole lot more, including implementing machine learning. In this case we will take a population dataset from US states, and try and predict the Cancer DR (Death Rates). The data set we will use is [here]:

Now, we will use a Predict Numeric Field experiment:
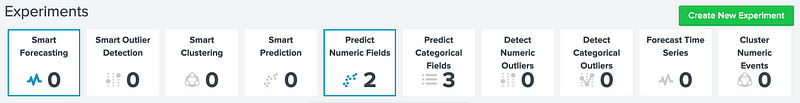
Next we create a new experiment:

Initally we will use Linear Regression to determine the numeric value of the Cancer DR:

Next we will use all the other fields in the data set — apart from the RegionState and Population Density — to train against:

We next select “Fit Model” and the predicte field is added:

We now have a Cancer DR, a predicted(Cancer DR), and a residual value. This residual value shows the differce between the real CancerDR and predicted(Cancer DR). Splunk now produces a chart of the linkage between the actual and predicted values:

So how good is the model? Well, we can measure the R² Statistic and the RMSE (Root Mean Squared Error):

We can then analyse the coefficients, and where Unemployment, Infant MR and Stroke DR are positive cofficients, and Homide DR and Motor Vech DR are negative coefficients:
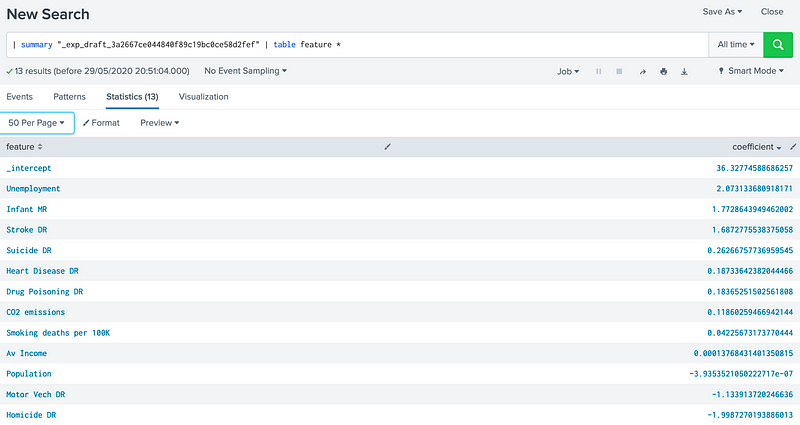
We can see that the Population has very little effect (-3x10^-7 — which is almost zero). Now we will try RandomForestRegressor:

Now, we plot, and we see improvements:

and an improvement on the R² value and a reduction in the RMSE:

Now we see the importance of the features:

and where the Infant MR, Smoking Deaths per 100 and Heart Disease DR are the most significant features, and Population, Unemployment and Suicide DR are the least signicant.
Now we will try the Lasso method:

The results are:

The results are similar to the previous method but are slightly poorer:

Now we see the following coefficients:

In this case an increase in the Motor Vech DR causes a reduction in the Cancer DR, and an increase in the Homicide DR is positively correlated to the Cancer DR.
So the best model is the Random Forest Regression, so here is the ranking of the significant factors:
- Heart Disease DR 0.4852065534763721
- Infant MR 0.2033007820827993
- Smoking deaths per 100K 0.09399038988407564
- Population 0.06500664364202598
- Drug Poisoning DR 0.04182069296705104
- Suicide DR 0.038094816780158594
- Av Income 0.023653424104559357
- CO2 emissions 0.01400126913457905
- Homicide DR 0.01177867216610513
- Motor Vech DR 0.008904899825803995
- Unemployment 0.0075216464629028965
- Stroke DR 0.0067202094735669795
- Heart Disease DR0.38581593445936674
We can see that Heart Disease DR and Infant DR are the top features, and Unemployment and Stoke DR rate is the lowest.