k-Means For Clustering in Splunk

k-Means For Clustering in Splunk
Clustering of data is an excellent way of simplifying classifications. In Splunk we can create a Cluster Numeric Event as an experiment:
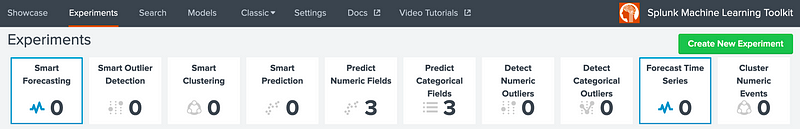
And create a new experiment:

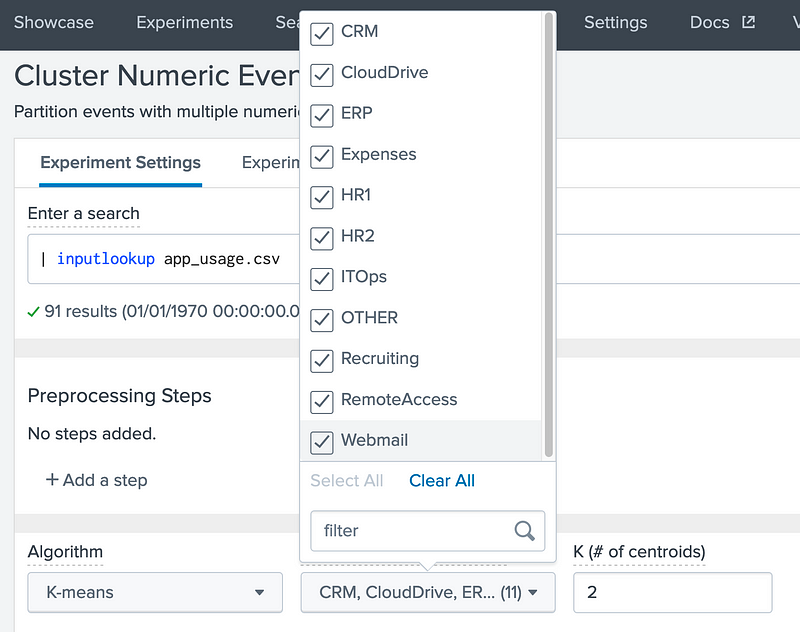
In this case we will use the app_usage.csv for analysis:

This data contains the usage of range of apps on a system for different days. In this case we analyse for CRM, CloudDrive, ERP, Expenses, and so on:

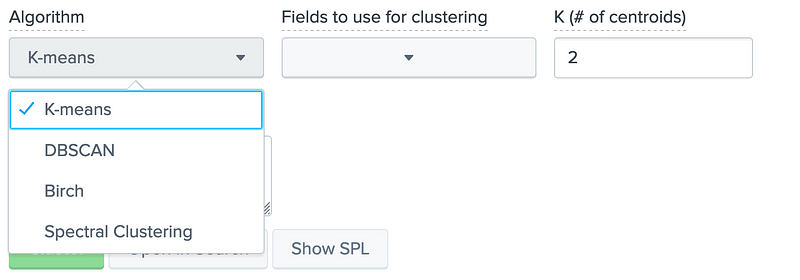
k-means clustering is used to seperate n observations into k clusters:
Initially we will cluster for all the features:
And which produces:

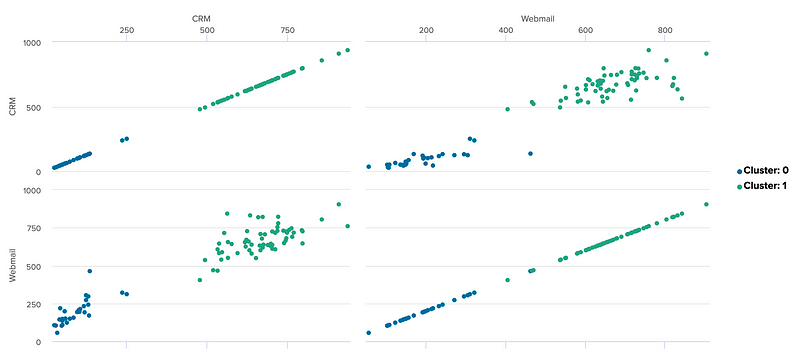
And then we can just plot for three features:

If we try for three clusters, we see that the clustering is less successful:

If we analyse CRM and Web email, see there are basically two clusters. The first is low ammounts of Webmail and low access to CRM, and the other is high amounts of access to CRM and Webmail: