Anomaly Detection With Splunk

Anomaly Detection With Splunk
We like to keep our finger on the pulse of the cybersecurity industry and make sure our graduates are ready for industry, and there’s one area that we continually hear of graduates getting jobs: “Splunk analytics”. It’s a package which is really taking over in the industry, and focuses on making sense of alerts and data generated. Overall, there’s two core things we typically look for: standard signatures of attacks; and anomolies. On many occassions, it just want to understand what “normal” is, and then detect when we move away from this.
So let’s use Splunk to detect an anomaly within a data set. With this we will aim to detect categorical outliers with a telephone call log. This we start with a new experiment:

and give it a name:

Our data set will include a log of calls, including the time of the call, the direction (incoming or outgoing), the duration, and the type of call (Voice or SMS) [data set here]:
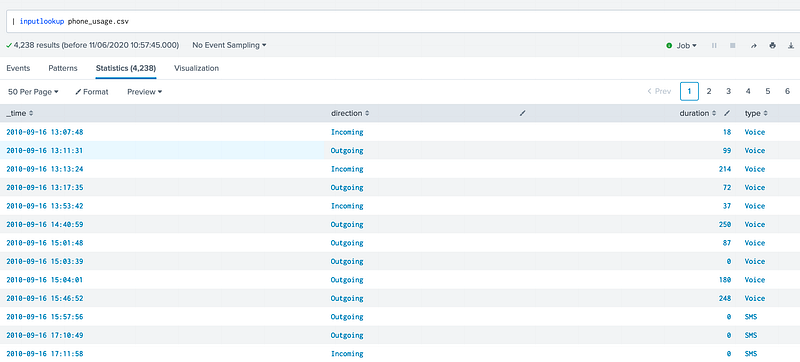
Now we can group together for a span 12 hours, and count the durations:
| inputlookup phone_usage.csv
| eval _time=strptime(_time, “%Y-%m-%d %H:%M:%S”)
| where type=”Voice”
| timechart count(“duration”) span=12h by direction
This gives the calls over a 12 hour period, and where on 16/09/2010 (Noon), there were three incoming calls, one missed call, and three outgoing calls:

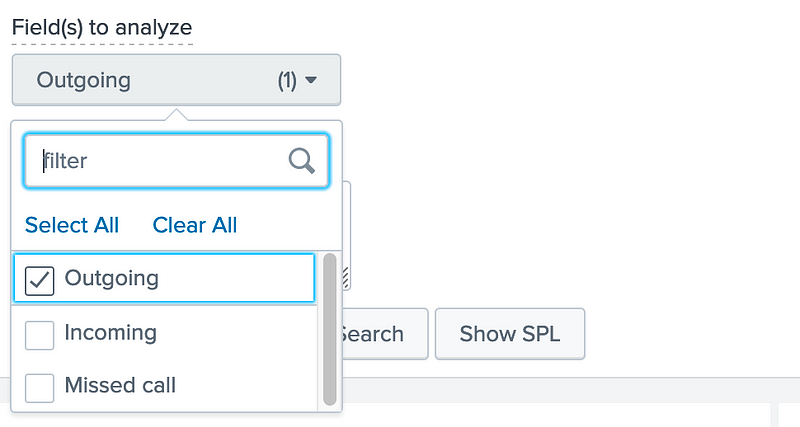
Now let’s see if we can try and detect outliers for outgoing calls for each 12 hour period:
This then gives us two outliers for 285 12 -hour periods:

We can see that there are two outliers, with 17 and 31 calls within a single 12 hour period. The SPL for this is shows that we use the anomalydetection comman on outgoing calls:
| inputlookup phone_usage.csv
| eval _time=strptime(_time, "%Y-%m-%d %H:%M:%S")
| where type="Voice"
| timechart count("duration") span=12h by direction
| anomalydetection "Outgoing"
| stats count as outlierCount
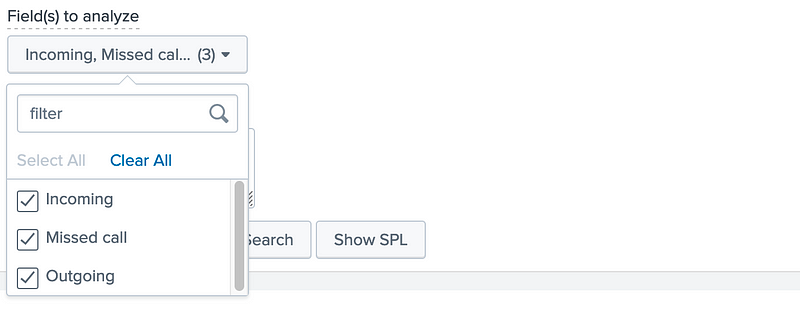
Now, we can see if we have any anomalies for incoming, missed calls and outgoing call durations:
And in the end we see one outlier where there were eight missed calls:

The SPL for this is:
| inputlookup phone_usage.csv
| eval _time=strptime(_time, "%Y-%m-%d %H:%M:%S")
| where type="Voice"
| timechart count("duration") span=12h by direction
| anomalydetection "Outgoing" "Incoming" "Missed call"
| stats count as outlierCount
Conclusions
If you are interested, we will be releasing a new Cyber&Data programme, and supported by The Data Lab. Here is a forthcoming course: